
We attended the Spokane River Forum Conference last week and learned tons about the unique watershed we work so hard to protect. One talk stood out for me though and I wanted to share it with you. John Covert of the Washington State Department of Ecology presented on the relationship between our summertime water use and the flow of the Spokane River.
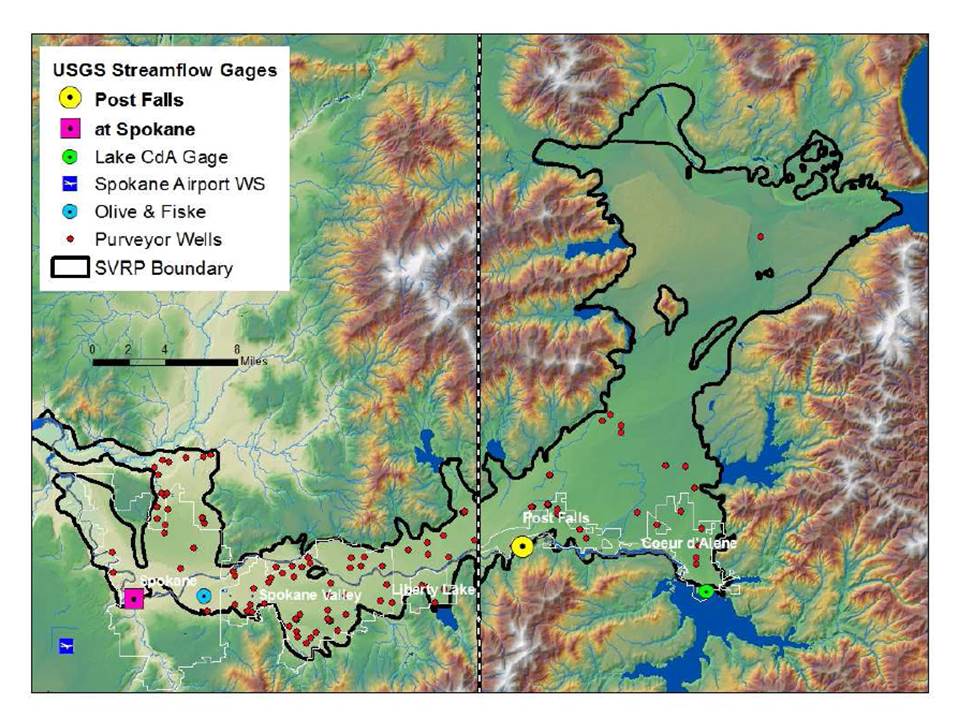
In the Spokane area we get our water from the massive 10 trillion gallon Spokane Valley-Rathdrum Prairie (SVRP) Aquifer which extends from Lake Coeur d'Alene north to Lake Pend Oreille and west to Spokane. What's interesting about this is that the river also receives water from the aquifer starting from downstream of the Sullivan Road Bridge. This cold influx from the SVRP aquifer to the river is what makes our river a great place for our native Redband Trout and to cool off in the heat of summer. The drought of 2015 allowed scientists to explore the relationship between our water use from the SVRP aquifer and River levels.
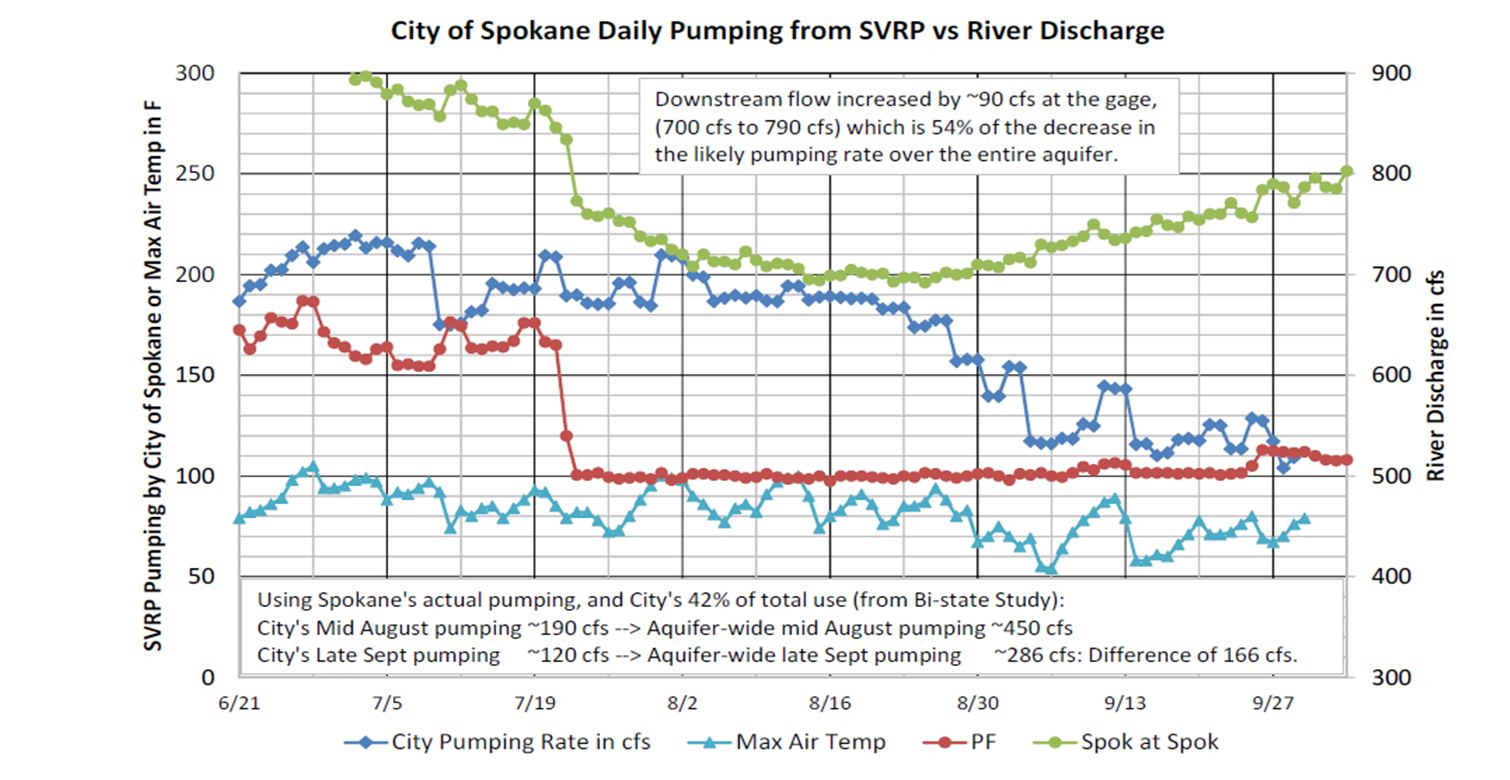
This summer was the hottest and driest on record in Spokane. Summertime river flows were the lowest on record for much of the summer. It was so dry that the Post Falls dam (yellow dot on map), which usually begins to draw down Lake Coeur d'Alene after Labor Day instead continued to discharge a relative trickle (500 cfs, red line on graph below) into the river throughout September and October. This had never happened before and allowed us to see a fascinating pattern (see graph below). Amazingly although the flow over Post Falls dam remained steady, the river began to rise at the gage in downtown Spokane (pink square on map above). Where is the extra water in the river coming from?
The explanation of this lies in the graph below. As the City of Spokane (dark blue) decreased their pumping rate the river (green) began to rise. Near the end of August the City of Spokane began to decrease their pumping rate, eventually reducing it about 70 cubic feet per second (cfs). The river began to respond in early September, eventually gaining about 90 cfs! This is approximately 13% of the river flow. Aquifer wide pumping decreased about 166 cfs during this period. Due to this reduction in pumping, the aquifer levels actually rose 0.5 ft (6 inches), resulting in more aquifer water discharging to the river. Comparing the maximum air temp (light blue) with the city pumping rate (dark blue), shows that during hot periods pumping increases.
These data show that decreases in water use increase the flow of the Spokane River. I suspect the variations in pumping rate are due to the typical summertime uses, such as lawn watering, which does not return water to the river. Most importantly, we have never seen such clear data on how personal water use choices affect our Spokane River. As summertime river levels continue to drop due to decreasing snow pack (another amazing and scary talk at the conference) and municipal water use continues to grow, our choices regarding water use will have even larger impacts to our river.