

During the summer of 2016, the Spokane Riverkeeper monitored water temperature in the Spokane River and Hangman Creek. The study was conducted to examine which areas of the watershed may contain unsuitable water temperatures for native Redband Trout and exceed Washington State's water temperature standards of 64F (18C). Not surprisingly, much of the Hangman Creek main stem and the Spokane River above Sullivan Road exceeded these temperatures. Surprisingly, many tributaries of Hangman Creek were much cooler than expected. Warning: This is a graph heavy post, but we wanted to get the data out there and will be following up with an in-depth report soon.
Spokane River
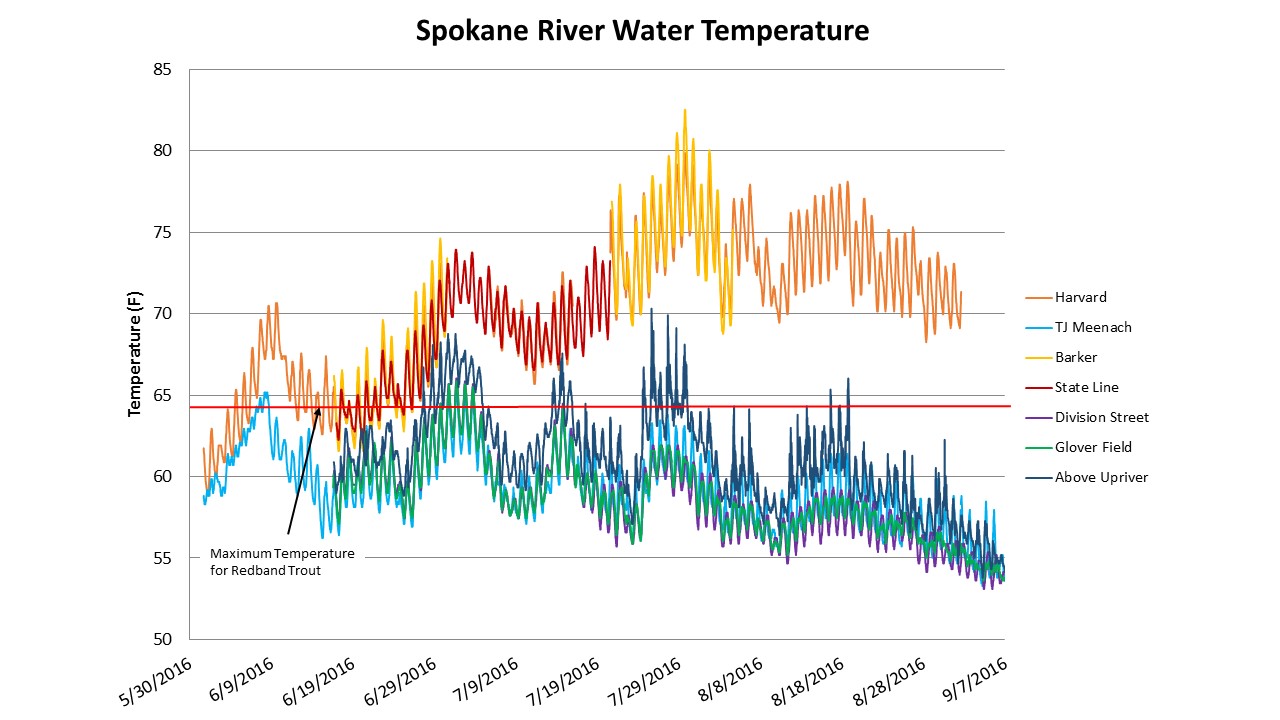
First, let's talk about the Spokane River. Spokane River water temperatures are best viewed in two sections – upriver and downriver of where the aquifer enters at Sullivan Road. Our upriver loggers were located at Barker Rd., Harvard Rd., and State Line, and downriver loggers at TJ Meenach Bridge, Glover Field, Division Street, and just above Upriver Dam. This separation in temperature trends is due to aquifer influence; aquifer water is cooler than surface water, particularly in the summer, as it is stored below ground. As indicated on the graph by the missing data, we had five loggers stolen over the course of the summer. Thankfully the upriver site of Harvard Rd. had enough data for us to compare its trends to downriver locations. (In lieu of this loss of equipment, PLEASE leave any scientific monitoring equipment you may come upon in the river be. Next year I will be placing replicate loggers at each site!)

The graph below shows the average, highest/lowest daily, and extreme instantaneous water temperatures recorded at each location. Even though there are missing data, the difference between the upriver and downriver sites isclear. Upriver sites exceed water temperature standards while downriver sites do not. Interestingly, the site above Upriver Dam (located just downstream of Boulder Beach) was the warmest of the downriver sites, and had days above the 64F (18C) standard.
The line graph below shows the temporal distinction between upriver (warm tones) and downriver (cool tones) trends. While both regions peaked in temperatures around late July and early August, downriver temperatures remained below the maximum habitable temperature for trout – indicated by the red line on the graph – for most of the summer while upriver temperatures were consistently above this limit. The upper Spokane River is uninhabitable for Redband Trout during the summer, raising the question of whether it should be listed.
Next year we plan to continue our Spokane River water temperature monitoring, focusing on just how hot the River is above the aquifer. We will add a number of sites and replicate our current sites.
Hangman Creek
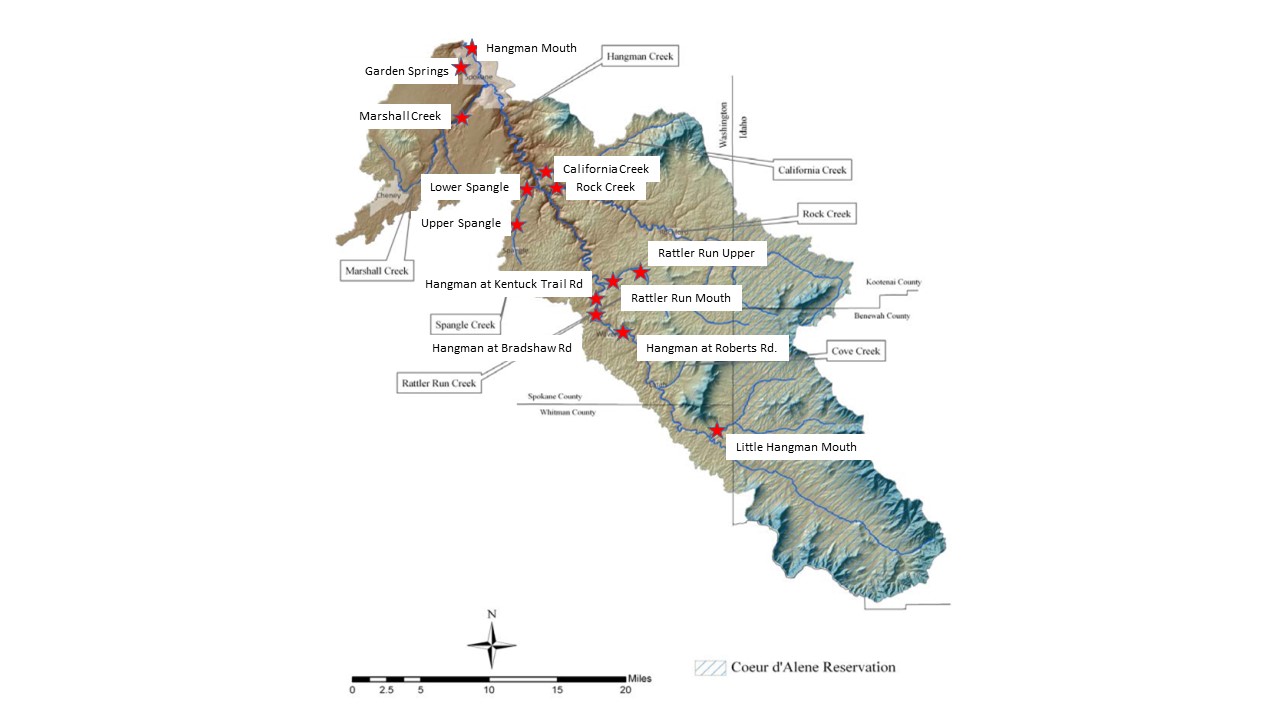
We placed loggers throughout the Hangman Creek watershed (see red stars on the map below), with four on the main stem and nine in tributaries. Spangle Creek went dry, leaving us with 11 total loggers that gave us water temperature data.
We found that Hangman Creek is significantly hotter than its tributaries. The boxplot below shows Hangman Creek locations on the left and tributaries on the right. No main stem location had average temperatures lower than any monitored tributary. This can be explained in part by the lack of riparian (streamside) vegetation along the creek. Though the tributaries do see influence from underground springs, if Hangman had adequate riparian cover along its entirety to filter non-point pollution and shade the creek from intense sunlight we may not see such a stark differentiation in temperature trends. One surprise from this graph was Rattler Run Creek. We expected it to have high temperatures because it flows through an intensely modified area of the Palouse, but instead it had the lowest temperatures of all the tributaries monitored.

Sorry for the messy graph below, but we wanted to show that parts of Hangman Creek rarely meet temperature standards for Redband Trout during the summer. While its tributaries do, Redband are unlikely to reach the sanctuary of the tributaries when Hangman’s main stem is uninhabitable from mid-May to early September.

Next year we plan to continue monitoring Hangman Creek watershed water temperature, focusing on more tributaries that may have temperature issues . We would also like to form a better picture of where the main stem of Hangman Creek gets so warm by expanding our monitoring locations into Idaho.
Thanks to intern extraordinaire Rachel Fricke for help writing and editing this blog!