Viewing entries in
Spokane Riverkeeper

Midnite Mine Update and White Paper

Comment

Midnite Mine Update and White Paper

The Midnite Mine is a closed uranium mine on the Spokane Indian Reservation, west of Wellpinit, WA. The company responsible for cleaning up the mine has requested that the EPA accept a substantially less stringent cleanup level to address contaminated surface materials at the Site.

Comment

2017 Phosphorous Study

Comment

2017 Phosphorous Study

We partnered with EWU to look at phosphorous loads in Hangman Creek during the spring of 2017.  The amount of phosphorous in our waters is extremely important to primary production in our surface waters, causing algal blooms and (indirectly) low dissolved oxygen in Lake Spokane.  Phosphorous is locally regulated in surface water discharges due to it's effect on Lake Spokane,

Comment

Calling the Salmon Home

Comment

Calling the Salmon Home

The Spokane Riverkeeper attended the canoe landing and Salmon Ceremony on the Columbia River at Kettle Falls. Before the construction of the Grand Coulee Dam, Kettle Falls served as a sacred gathering spot for tribes and First Nations peoples during salmon runs. The Ceremony of Tears in 1940 was the last Salmon Ceremony held before Kettle Falls was permanently inundated with water and the salmon runs blocked - until 2016 when these canoes were built by tribes of the Upper Columbia River Basin and the journey to Kettle Falls and tradition of the Salmon Ceremony revived.

Comment

Summer 2016 Water Temperature Round-Up

Comment

Summer 2016 Water Temperature Round-Up

During the summer of 2016, the Spokane Riverkeeper monitored water temperature in the Spokane River and Hangman Creek.  The study was conducted to examine which areas of the watershed may contain unsuitable water temperatures for native Redband Trout and exceed Washington State's water temperature standards of64F (18C).  Not surprisingly, much of the Hangman Creek main stem and the Spokane River above Sullivan Road exceeded these temperatures.  Surprisingly, many tributaries of Hangman Creek were much cooler than expected.  Warning: This is a graph heavy post, but we wanted to get the data out there and will be following up with an in-depth report soon.

Comment

Reducing Pollution One Permit at a Time

Comment

Reducing Pollution One Permit at a Time

Spokane Riverkeeper has been hard at work over the past few months putting together comments (see link at bottom) on draft National Pollution Discharge Elimination System (NPDES) Permits for three dischargers on the Spokane River – City of Liberty Lake Waste Water Treatment Plant (WWTP), City of Spokane WWTP and Polychlorinated Biphenyls (PCBs), and Kaiser Aluminum, LLC.  Our comments on these permits reflect the need for strong limits on pollutants entering our river. 

Comment

Comment

In Hot Water: A Preview of Water Temperatures in the Spokane Watershed, 2016

Rachel Fricke, a Spokane native who comes to us from the University of Southern California, is our Fall Intern. Below, she discusses our recent summer temperature findings. paddling-hangman1


For the past month, I’ve had the pleasure of running around the Spokane River watershed collecting and recording data from temperature loggers that were placed back in June. Why does Riverkeeper care about temperature? Though temperature is not a physical or chemical pollutant, it has a direct impact on the organisms inhabiting our river and its tributaries.

The majority of freshwater-dwellers are cold-blooded, meaning their internal body temperature aligns with the temperature of their external environment. Should these organism’s internal temperatures become too hot, their cells begin to die, eventually causing mortality. Redband trout, a prominent species in the Spokane River ecosystem, live and spawn at an optimum temperature of 57.2° F. They can withstand temperature variances of a few degrees, but will not occupy regions where water temperature is significantly higher than optimum.

Our summer loggers from the Spokane River showed that temperatures reached their highest (~83° F) at the Harvard and Barker Road bridge crossings. This makes sense because these locations are upriver from where groundwater from the aquifer – which is cooler than surface water – begins feeding into the river. Further downriver at TJ Meenach we recorded a high of 63°F – a habitable temperature for Redband.

river-temps-2016

On Hangman Creek, our loggers recorded significantly elevated temperatures. At the mouth, where Hangman flows into the Spokane, temperatures peaked at 79° F.  Just downstream from Tekoa at Waverly we recorded our highest water temperatures from the entire watershed – a whopping 84° F.

Hangman’s banks in this region have little to no riparian cover, also referred to as streamside forestation. Plant growth alongside streams is essential for healthy stream temperatures as it shades creek water. Hangman Creek’s current conditions in the Waverly area leave creek water directly exposed to the Palouse’s intense summer sun and heat, resulting in heightened water temperatures.

Check back within the coming weeks for a comprehensive report of this year’s temperature and water quality data. For more information on Redband trout, the Western Native Trout Initiative is a great reference.

paddling-hangman-2


Comment

Comment

How water use affects the Spokane River

We attended the Spokane River Forum Conference last week and learned tons about the unique watershed we work so hard to protect.  One talk stood out for me though and I wanted to share it with you.  John Covert of the Washington State Department of Ecology presented on the relationship between our summertime water use and the flow of the Spokane River. Slide4

In the Spokane area we get our water from the massive 10 trillion gallon Spokane Valley-Rathdrum Prairie (SVRP) Aquifer which extends from Lake Coeur d'Alene north to Lake Pend Oreille and west to Spokane.  What's interesting about this is that the river also receives water from the aquifer starting from downstream of the Sullivan Road Bridge.  This cold influx from the SVRP aquifer to the river is what makes our river a great place for our native Redband Trout and  to cool off in the heat of summer. The drought of 2015 allowed scientists to explore the relationship between our water use from the SVRP aquifer and River levels.

This summer was the hottest and driest on record in Spokane.  Summertime river flows were the lowest on record for much of the summer.  It was so dry that the Post Falls dam (yellow dot on map), which usually begins to draw down Lake Coeur d'Alene after Labor Day instead continued to discharge a relative trickle (500 cfs, red line on graph below) into the river throughout September and October.  This had never happened before and allowed us to see a fascinating pattern (see graph below).  Amazingly although the flow over Post Falls dam remained steady, the river began to rise at the gage in downtown Spokane (pink square on map above).  Where is the extra water in the river coming from?

The explanation of this lies in the graph below.  As the City of Spokane (dark blue) decreased their pumping rate the river (green) began to rise.  Near the end of August the City of Spokane began to decrease their pumping rate, eventually reducing it about 70 cubic feet per second (cfs).  The river began to respond in early September, eventually gaining about 90 cfs!  This is approximately 13% of the river flow.  Aquifer wide pumping decreased about 166 cfs during this period.  Due to this reduction in pumping, the aquifer levels actually rose 0.5 ft (6 inches), resulting in more aquifer water discharging to the river.  Comparing the maximum air temp (light blue) with the city pumping rate (dark blue), shows that during hot periods pumping increases.

covert graph

These data show that decreases in water use increase the flow of the Spokane River.  I suspect the variations in pumping rate are due to the typical summertime uses, such as lawn watering, which does not return water to the river.  Most importantly, we have never seen such clear data on how personal water use choices affect our Spokane River.  As summertime river levels continue to drop due to decreasing snow pack (another amazing and scary talk at the conference) and municipal water use continues to grow, our choices regarding water use will have even larger impacts to our river.

Comment

Comment

Press Release: Coalition of Conservation Groups, Industry, and Municipal Government Challenge Hatchery Permit for Impacts of PCBs to the Spokane River

For Immediate Release: January 19, 2016 Media Contacts:

Jerry White, Jr, Spokane Riverkeeper (509) 464-7614

Rick Eichstaedt, Center for Justice (509) 464-7607

Mike Petersen, The Lands Council (509) 838-4912

Adrienne Cronebaugh, Kootenai Environmental Alliance (208) 667-9093

Coalition of Conservation Groups, Industry, and Municipal Government Challenge Hatchery Permit for Impacts of PCBs to the Spokane River

Challenge seeks a permit that requires PCB testing and participating in regional PCB task force

SPOKANE, WA–Last week, a coalition of conservation groups consisting of the Spokane Riverkeeper, The Lands Council, the Kootenai Environmental Alliance, and the Lake Spokane Association, along with the Inland Empire Paper Company and the City of Coeur d’Alene filed a challenge to the Washington State Pollution Control Hearings Board of a pollution discharge permit issued by the Washington Department of Ecology for the operation of a fish hatchery on the Little Spokane River.

The appeal raises concerns about the permit’s failure to adequately address impacts of the hatchery to water quality in the Spokane River, particularly impacts from toxic polychlorinated biphenyls (PCBs).  While hatcheries do not produce PCBs, a 2006 report raised concerns about the presence of PCBs in hatchery fish food, its impact on PCB levels in fish tissue, water quality impacts in the hatchery water discharge, and impacts to PCB levels in the Spokane River.

The appeal seeks measures that would require the hatchery to conduct the same type of monitoring and to participate in the Spokane River Regional Toxics Task Force (SRRTTF) in the same manner as other PCB dischargers, including Inland Empire Paper Company and the City of Coeur d’Alene.

“The Department of Ecology and the Environmental Protection Agency requires the cities and industries on the Spokane River to vigorously monitor their discharges for PCBs and to participate in a regional toxics task force,” said Jerry White, Jr., Spokane Riverkeeper.  “We don’t want to shut down the hatchery,” said White. “We just want to make sure that all dischargers follow the same rules.”

“What we are after is parity,” said Mike Petersen, director of The Lands Council.  “The other dischargers are spending a significant amount of money and time monitoring impacts and participating in the Toxics Task Force.  It is not unreasonable to expect that the Fish and Wildlife do the same.”

“Communities on both side of the state are taking the problem of PCBs in the Spokane River seriously,” Adrienne Cronebaugh, director of the Kootenai Environmental Alliance based in Coeur d’Alene, Idaho.  “That means every potential source of PCBs needs to take action to reduce and, if possible, eliminate PCBs.”

Once widely used in everything from electrical insulators to underwater paint, PCBs are now considered a long-lived pollutant associated with increased risk of cancer, reduction of immune function and impairment of the neurological development of fetuses.  The family of chemicals, polychlorinated biphenyls, lasts for years in the environment. PCBs can concentrate in fat, and are passed along through the food chain when one animal eats another.  PCBs are toxic in extremely small quantities.  Current regulations prohibit PCB dischargers in quantities measured in the parts per quadrillion.

The Spokane Hatchery operated by the Washington Department of Fish and Wildlife was built in 1934 and is one of the State's original hatcheries. It is one of the major Rainbow Trout facilities in the state. The facility also raises German Brown Trout, Eastern Brook Trout, Cutthroat Trout, Tiger Trout, and Kokanee Salmon.

The Pollution Control Hearings Board hears appeals from orders and decisions made by the Department of Ecology. The Board consists of three members, who are appointed by the governor and confirmed by the State Senate for staggered six-year terms.

Comment

Comment

Pollution Enforcement in Washington State (or lack thereof)

Washington State has two approaches to protect the quality of the public’s water from agricultural pollution. Sadly, neither is functioning to provide the healthy, clean water that the public is entitled to.  In one approach, the federal government provides funding that is made available through the counties and the State to fund voluntary programs to address agricultural water quality problems. In the second approach, the Washington Water Pollution Control Act gives the Washington Department of Ecology (WDOE) the authority to regulate farm practices that protect water quality. This authority was upheld by the Washington Supreme Court in the Lemire vs Ecology case in August of 2013.  Ideally, participation by the agricultural industry in voluntary programs would work in concert with regulatory frameworks to re-enforce a culture of lawful behavior and practices that ensure public values are protected. Enforcement and complaints1

Within the regulatory process, Ecology identifies farm operations that are polluting the public’s water through citizens’ complaints and a Watershed Evaluation Process. They proceed with offering farm operations technical and financial assistance to correct their behavior and improve their practices via violation letters.  If the behavior is not corrected, then punitive orders may be issued with associated fines.  As a result of a Freedom Of Information request, we received data on the number of complaints, violation letters, warning letters, orders and fines levied by the Department of Ecology since the Lemire case was decided in August of 2013.  We also received information on the types of pollution these violation letters addressed.  These data show that Ecology's rarely uses their regulatory ability and agricultural pollution violations continue to go unaddressed in Washington State.

In the Eastern Region and the Spokane River Watershed, regulatory framework is in place but through inaction has become dysfunctional and counter-productive.   For example, since the Lemire case in the Eastern Region, 74 complaints have been lodged with WDOE and  129 follow-up, violation letters that offer technical and financial assistance have been sent to farm operations that are violating water quality law.  Astoundingly, no administrative orders have been issued nor fines levied.  (To illustrate this pattern, see Figure 1 for comparison of Eastern Regional Office to Bellingham Field Office).

Enforcement and complaints

Further, records show that of those 129 problem cases identified by WDOE, only a single farm has corrected their behavior and cleaned up their operations.  Inside the Eastern Region, the Spokane River tributary of Hangman Creek continues to have the worst water quality in the state (Figure 3).  In this watershed our records show that out of 22 active pollution cases (since 2013) none have been corrected.

wqi

This inaction has created a norm in which agricultural industry breaks the law with impunity and virtually ignores water quality concerns. Ultimately, this inaction has sent a clear message that actual protection of the public’s surface water is not a priority for WDOE and emboldened polluters with the message that absolutely no enforcement is forthcoming for violators. In our watershed, as across the State, lawful behavior has broken down and as a result, the public is knowingly being deprived of clean water, healthy fisheries and functioning ecological corridors that our rivers should deliver.  As our campaign for clean water in Washington State develops, we will soon have ways that you can let your voice be heard.  Citizens speaking for clean water are the most powerful tool we have to let our legislators know that the public demands action.


Comment

1 Comment

PCB's 101: A Summary of PCBs and the Spokane River

A note from the Spokane Riverkeeper:  A huge thanks to our intern, Amy Shafer, for researching and writing this blog post.  Her introduction to PCBs comes at a crucial time in Washington State for toxins in our waters.  The EPA recently proposed an alternative water quality standard  and Federal Human Health Criteria that is superior to Washington State's draft proposal.  In the State's rule, the allowable cancer risk rate of those who consume fish from Washington State waters is raised from one case of cancer in one million citizens to one case in one hundred thousand citizens.  This has implications for all people who catch and east fish in Washington State, especially those who consume larger amounts of fish, who are very young or are pregnant.  The Spokane Riverkeeper supports the adoption of the proposed EPA rule which calls for the more protective 1:1,000,000 cancer risk rate.   Please comment here or wait and watch our Facebook page and email blasts for the "talking point" highlights from Riverkeeper comments. Most people in the Spokane area are aware that the Spokane River is polluted. But what is it that’s actually polluting and harming the river and the animals in and around it? PCBs are toxic substances that are greatly affecting the Spokane River and pose a risk to human health.

What are they?

PCB stands for Polychlorinated Biphenyls. These are two benzene rings with 1-10 chlorines attached to them. There are 209 different arrangements of chlorine on these structures and these are called cogeners. PCBs are chemicals that come from old electrical equipment and modern day dyes and pigments. They travel via the air and water, becoming attached to sediments and particles in the water of the Spokane River. They move through the food web of aquatic animals and make their way up the food chain to humans who are eating the fish from the River. PCBs were initially developed in 1929 and were used in several types of equipment because they did not break down, burn, or conduct electricity. They were made illegal in 1979 but the laws allowed some uses to continue under allowable levels of toxicity.

Where do they come from?

PCBs were originally used in many things. They were found in transformers, capacitors, lubricants, caulk, paint, lamp ballasts, florescent lighting, and even newsprint. When PCBs were made illegal these stopped being manufactured but those that were already in use were permitted to continue being used. In addition to these legacy manufactures, there are 70 known manufacturing processes that are inadvertently making PCBs that continue to occur because PCBs are made as a byproduct. The most well-known and studied of these processes is the making of dyes and pigments. PCBs have been found to correlate with brighter colors in paints, pigments, inks, and dyes so it is found in most colored papers, cardboard, plastics, and textiles. The PBCs get released into the environment through manufacturing, use, disposal, and recycling processes.

Fig 1. Once PCBs are in the sediment in bodies of water, they are taken up by invertebrates and make their way up the food chain. Image courtesy of: http://www.epa.gov/housatonic/understandingpcbrisks.html#HowPlantsAnimals

PCBs travel through the air until they are eventually deposited onto surfaces where they are then washed away through water and end up in areas like the Spokane River. They don’t dissolve in water and instead attach themselves to mud, organic particles, and sediments at the bottom of the river. The organic particles in the river are then consumed by invertebrates, which are generally at the bottom of the food chain. PCBs are stored in the fat of animals so when that animal gets eaten, all of the PCBs it consumed in its lifetime end up in the predator that ate it. This results in a higher concentration of PCBs in animals’ systems the higher up the food chain one goes. This process is known as bioaccumulation. By the time PCBs reach fish in the Spokane River, the amount of PCB in the tissue is dangerous to consume.

What do they do?

PCBs increase the risk of cancer and other health issues in animals and humans. Studies of people who have been highly exposed to PCBs have shown that PCBs cause skin rashes, immune disorders, liver disease, reproductive disorders, and neurological and behavioral problems, and cancer. While PCBs are dangerous for everyone, there are some people who are especially at risk. People are more likely to come in contact with PCBs if they work around contaminated equipment and materials, work in buildings with PCB materials or florescent light ballasts, or consume fish and seafood from contaminated waters. Small children are more likely to be affected by PCBs as they are still developing and growing and pregnant women who are exposed to high levels of PCB have infants who tend to show neurobehavioral problems. PCBs are stored in fat rather than blood and the human body absorbs it rather than secretes it. Because the body does not remove PCB from its system, the amount of PCB in an individual will increase with age. In 2014 PCBs were reclassified from “probable human carcinogens” to “human carcinogens” by the International Agency for Research of Cancer.

Experiments have been run throughout Washington to find the effects of PCBs on various animals that have been exposed to them. Fish, birds, and mammals such as sea lions, seals, and mink have shown negative effects of exposure to PCBs. They all had reproductive problems, poor muscle coordination, week immune systems, and deformities in their skin and skeletons.

What are we doing about this issue?

The Spokane Riverkeeper mission is to protect and restore the health the Spokane River watershed, and accomplishes that goal through collaborating, educating and when necessary litigating. In 2011 the Spokane Riverkeeper helped create the Toxics Task Force. Its job regarding PCBs is to identify sources of PCBs and reduce the amount of PCBs in the Spokane River. The Task Force is making efforts to consolidate data about PCB sources, transportation, and what becomes of them. They are working on finding the different sources that are involved in dispersal of PCBs through stormwater. They did a massive data collection during dry weather and they intend to do another collection later during a wet season.  The Spokane Toxics Task Force is also trying to identify and reduce PCB production in consumer products where PCBs are a byproduct

Another way we have been trying to bring about change is through political arenas. The Spokane Toxics Task Force has worked for PCB restriction, encouraged purchase of low and non-PCB products for public use, and addressed the need to reduce inadvertently made PCBs. In June of 2014 the City of Spokane enacted an ordinance that had a preference for City purchases to be PCB free. We are also working on public outreach. Measures are being taken to educate the community about what PCBs are and the dangers that they bring about. One example is fish advisories that have also been created by the Washington Department of Health to let people know what fish is safe to eat and where in the river it can be caught from. (see image below).  Additionally, all Washington Waterkeeper's are advocating for the most protective Human Heath Criteria as proposed in the EPA's draft rule.  The Spokane Riverkeeper will be asking people to sign letters, and make comments in support of a very protective rule.  Such a rule will help in the reduction of PCBs entering.

This fish advisory was created by the Washington Department of Health and the image is courtesy of: http://spokaneriver.net/public-guide-2/fish-consumption-advisory-cleanup/

Why should you care?

Being aware of health issues in the community is key to keeping yourself and your family healthy and happy. When you go to swim in the Spokane River you should be sure to wash off hands, feet, face, and toys before eating or leaving. If you eat fish from the Spokane River you should be sure to eat no more than the advised amount set by the Washington Department of Health.

We at Spokane Riverkeeper are doing all that we can to stop pollution of the Spokane River and keep our environment clean. We cannot do this alone though. You can also help your community by donating money or volunteering your time to help us out. The Spokane River clean-up was a huge success this year and we owe that to citizens of Spokane like yourself. Stay informed of what’s going on in your local community and take ownership for the beautiful environment around you. This river belongs to all of us, let’s make it something to be proud of.

Picture courtesy of: http://spokaneriver.net/meet-me-at-the-river-raft-and-kayak-eco-tours/

Our guest author, Amy Shafer, is a senior at Gonzaga University studying biology and political science, with aims to work in environmental policy.  She interns as a our PCB Outreach Coordinator. 

1 Comment

Comment

Spokane River Temperature Study

The summer of 2015 brought historically hot and dry conditions to the Inland Northwest.  Record low rainfall and record high heat, combined with very low snowpack, caused record low flows on the Spokane River.  We knew little about what these conditions would have on water temperatures in the Spokane River, so we placed continuous water temperature loggers in a few areas of the river.  Due to the complex interaction between the Spokane-Rathdrum Prairie Aquifer and the Spokane River, we expected to see a wide range of water temperatures.  What we found were water temperatures that reflected the complex interaction with our aquifer, upriver temperatures that were too hot for our native Redband Trout, and data that led to many more questions.   First, a bit of Spokane River hydrology. The Spokane River flows out of Lake Coeur d'Alene and over the Post Falls Dam.  The water in this "losing reach" of the Spokane River between Lake Coeur d'Alene and Sullivan Road is slowly seeping into the ground, replenishing our groundwater.  Water temperature in this stretch of the river should be similar to the water temperature at the surface of Lake Coeur d'Alene, plus any warming that occurred in the river.  Ground water also feeds the Spokane River.  The Spokane-Rathdrum Prairie Aquifer, provides cool groundwater to the "gaining reaches" of the Spokane River (see map below), which come in mostly below Sullivan Road.  Water temperatures in and downriver of these gaining reaches should be much cooler than the upriver section of river, depending on the proportion of cool aquifer water in the river.

In late June we saw dead fish and measured very warm temperatures in the Spokane River near Barker Road.  This prompted us to place temperature loggers at five locations along the Spokane River in early July.  Two at losing reaches in the upriver section at Harvard Road and Barker Road and three at gaining reaches at Islands Trailhead, Water Street (downstream from downtown), and TJ Meenach Bridge (see map below). temperature logger locationsOur method was simple, we placed Hobo Tidbits temperature data loggers which we set to record water temperature every 30 minutes in a short PVC tube for shade.  They were then placed in the river at a depth of about two feet.  The logger placed at Water Street was stolen, but the other loggers recorded temperature data from 7/16/15 to 8/20/15.

Water temperatures in the Spokane River varied dramatically between some locations.  The average temperature at Harvard and Barker Road was 23.6 and 23.5 C, respectively, while the temperature downriver at Islands Trailhead and TJ Meenach Bridge was 13.6 and 15.1 C, respectively.  This is a difference of over 8.5 C (15 F).  This difference shows the influence of the aquifer on the down and upriver sections of river.

Data Summary of Spokane River Temperature Gages (summary courtesy of Allan Scholz of EWU)
         Location                Dates (inclusive)                Average temp (C)                   Range of daily average temp (C)      
    Islands Trailhead           July 16 – August 20            13.6                   12.7 (on 8/20) – 15.9 (on 7/20)
        Harvard Rd           July 16 – August 20           23.6                 22.3 (on 7/27) – 24.7(on 8/13)
        TJ Meenach           July 16 – August 20           15.1                14.2 (on 8/20) – 17.1 (on 8/12)
        Barker Rd             July 16 – August 20             23.5                  21.7 (on 7/26) – 25.5 (on 7/20)

Looking at the data graphically, it gets a bit more interesting (see graph below).  The upstream loggers at Harvard and Barker Road showed very similar patterns.  Comparing the upstream loggers to the minimum and maximum air temperatures in Spokane (data courtesy of NWS Spokane), shows that warmer air temperatures translate into warmer water temperatures (no surprise there).  Differences between daily maximum and minimum water temperatures at the upriver loggers were about 5 C, and varied between about 20 C and 27 C.

The two loggers influenced by the aquifer, at Island Trailhead and TJ Meenach Bridge, showed much cooler temperatures, small temperature variation, and seemed to be influenced less by air temperature than by other factors.  Temperatures at these locations varied by about 2 C daily, between approximately 12 and 17 C degrees at Island Trailhead and 14 and 17 C degrees at TJ Meenach Bridge.  Although daily air temperatures do seem to affect water temperatures at these locations, another factor may have an even larger affect.

spokane river temperature graph 
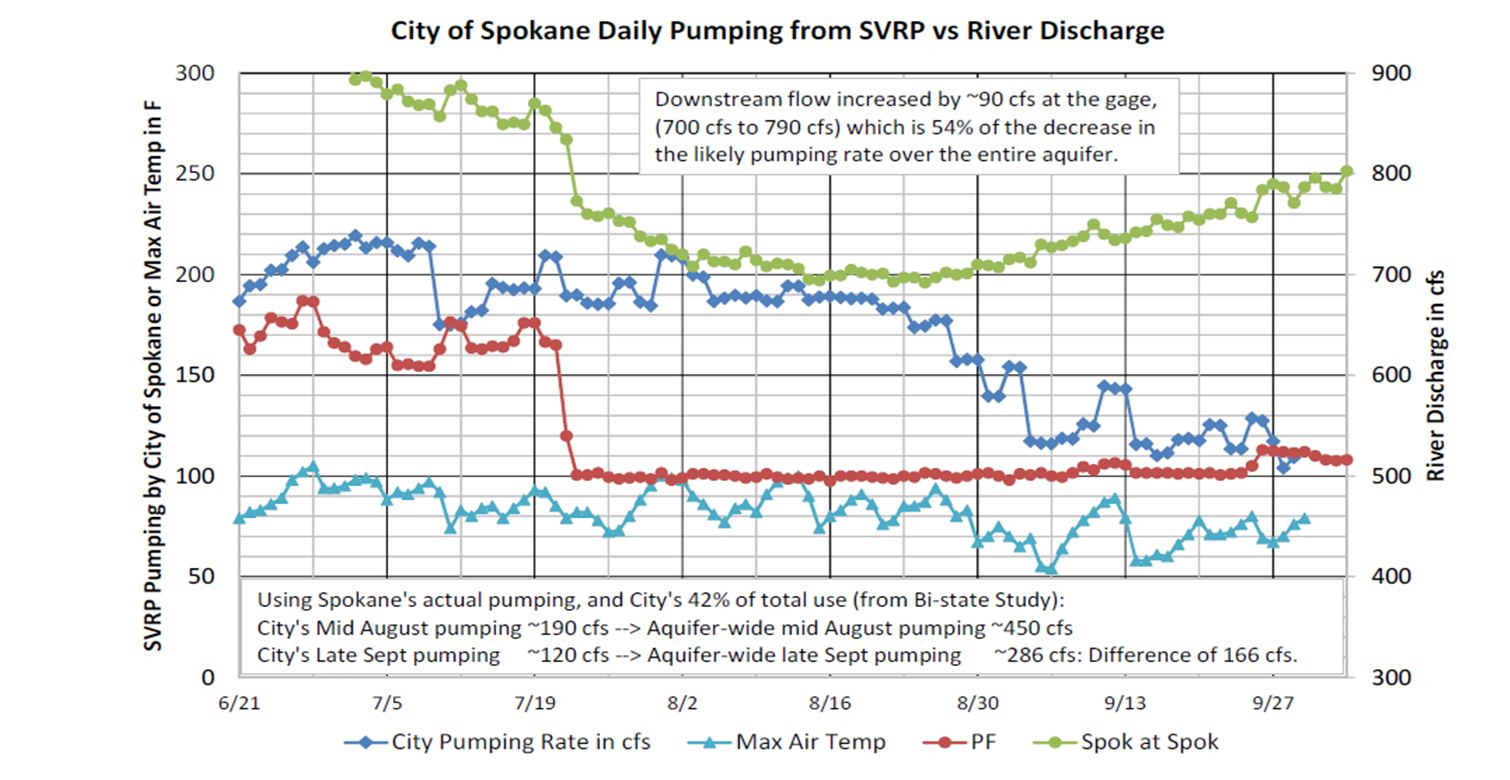
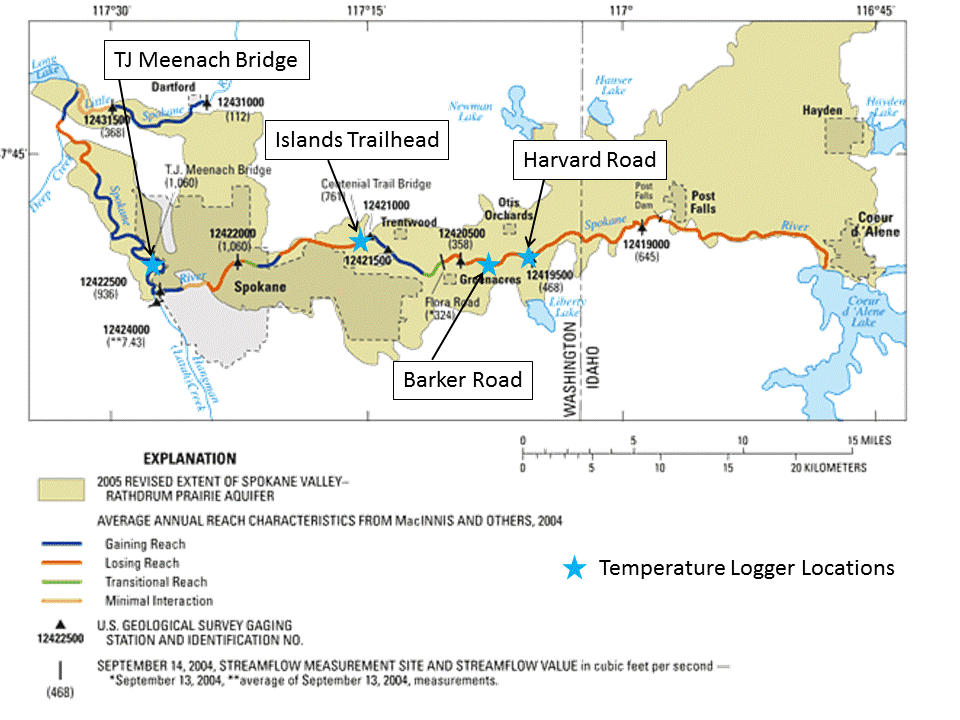
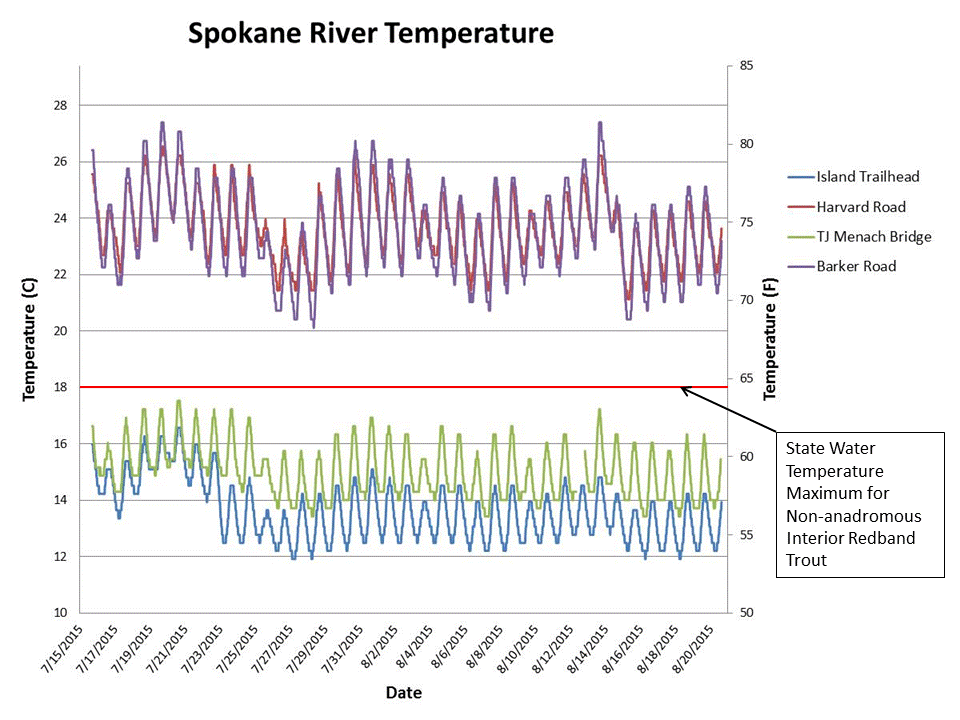
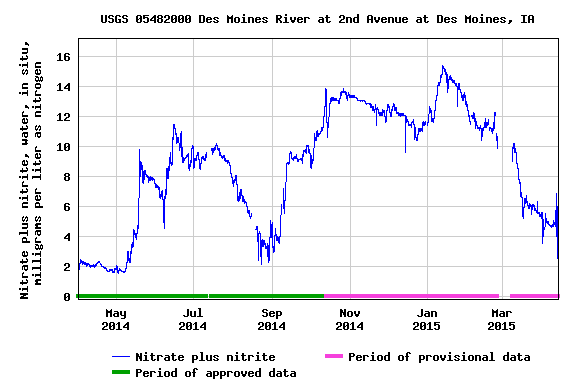
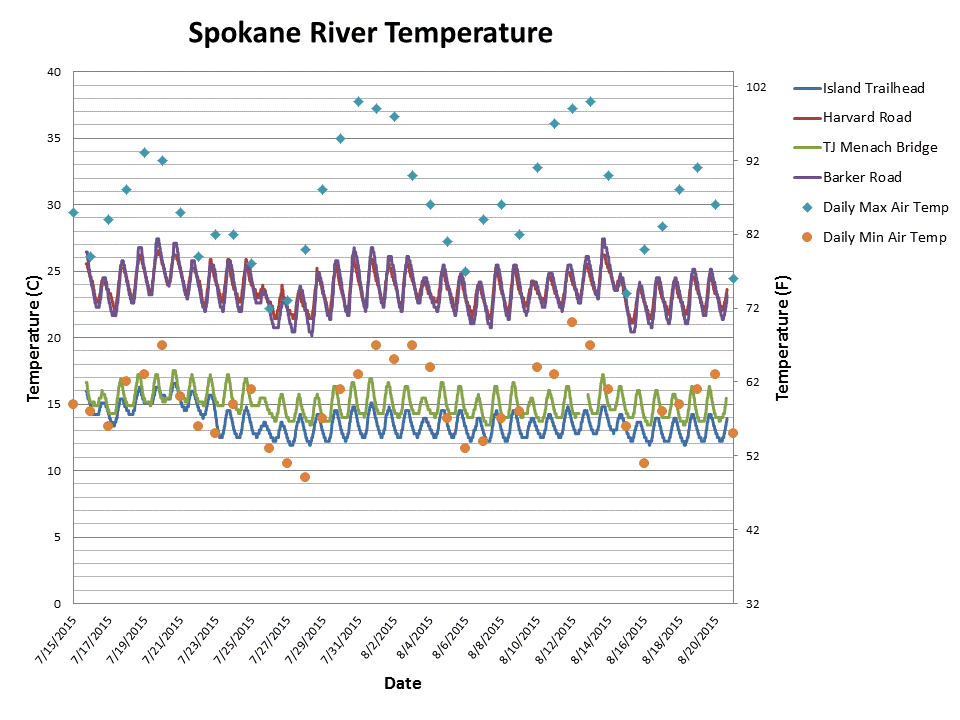
After 7/23/15 water temperatures at Island Trailhead become much colder than that at TJ Meenach Bridge, having remained similar for the previous week.  This divergence in water temperature correlated with the reduction in flow out of the Post Falls Dam (see flow graph below) from 640 cubic feet/second (cfs) to 500 cfs.  The drop in water temperature at Islands Trailhead could be due to the reduction of warm water flowing over the dam and into the river,  increasing the proportion of the cool aquifer water in the river at Islands Trailhead.  Although this explains the drop in temperature at Islands Trailhead, it does not explain the divergence of water temperatures between Islands Trailhead and TJ Meenach Bridge.  More data will be required to explain why temperature at TJ Meenach remains more or less constant, while flow seems to affect water temperature at Islands Trailhead.

post falls gage 7-18-15 through 8-20-15

Water temperatures in our river affect our native Redband Trout, a fish that needs cool, clean water to survive.  Water temperatures seen this summer in the upper river are much too high for trout (see graph below).  In fact, trout numbers in this stretch of the river are dropping.  Although competition and predation from other fish likely play a role, during some summers water temperatures are much too hot for trout in this section of river.

spokane river temperature graph with redband criteria

Next summer the Spokane Riverkeeper hopes to expand this study.  If we can find funding to purchase more temperature data loggers, we can monitor more sections of the Spokane River, including tributaries.  Our studies will provide long term data in a river system that has complex temperature dynamics, that as far as we know, is not being taken by any one else.


Comment

2 Comments

A Guide to the New Downtown Spokane River Access Point

The new Downtown Spokane River Access Point opens this week.  Located directly under the Division Street Bridge off of the Centennial Trail on the south side of the Spokane River, the launch provides canoers, kayakers, and paddleboarders convenient water access in downtown Spokane. I launched the Riverkeeper canoe there this week for my weekly litter pickup and thought I would give you a quick guide to the Division Street Boat Launch. IMG_2536

The launch provides walk up access to the water on a six foot wide gently sloping gravel path making it easy to launch canoes, kayaks, and paddleboards.  However, vessels without paddles such as inner tubes and small rafts should not be launched here because the upper falls dam is directly downstream of the launch (in fact it is illegal to float west of the Division Street Bridge).  Large rafts and boats cannot be launched here as well.

Parking:   I unloaded my canoe at the Courtyard by Marriott, which is the closest parking lot to the access point.  I checked with the front desk and they are happy to let river users load and unload gear in their parking lot, but do not allow parking for non hotel users.  After unloading, I parked at the metered all day on street parking on Spokane Falls Blvd. and Pine ($1 per 2.5 hours, bring change).  If you are just out for a quick paddle, one hour free parking is located on E. Olive Way, in front of the Marriott.  Alternately, the Convention Center has covered pay parking in its parking garage or you could park in one of the many lots operated by Diamond parking near the River Access.

parking for division street launch3

Using the River Access Point:  I quickly navigated the stairs and ramps down to the River Access lugging our 80 pound canoe.  After that it is an easy walk down to the Spokane River on the graveled ramp.  This year water levels in the Spokane River are very low, creating a perfect low current environment to launch our canoe.  I simply placed the canoe in the water, donned my PFD, and paddled away.  I didn't want to set my canoe down on the rocks at the bottom of the ramp and risk dinging it.  During higher flows or high winds an anchor or rope would be handy to prevent your vessel from drifting away.

division street launch div bridge from water

On the Water Experience:  From the River Access Point, you must paddle upstream (east) to avoid the Upper Falls dam.  However, there are plenty of warning signs so don't worry about getting confused.  Traveling east along the river is a serene, flat water experience, with little current and incredibly clear water.  No rapids exist in this stretch of water, making it an ideal place to paddle.    I saw numerous trout rise and plenty of large sucker fish on the rocky river bottom.  The riverbank along this stretch of the Spokane River is tree lined and somewhat steep, with the views of the Centennial Trail and the occasional office building.  The aquifer feeds this part of the Spokane River, creating remarkably cold and clear water.  I easily paddled up to the No-Li brewery and back in about 2.5 hours, stopping to pick up some litter along the way.

Summary:  The Downtown Spokane River Access Point provides a very easy way for canoers, kayakers, or paddleboarders to get a quick paddle in on a unique stretch of the River.  Opening this stretch of river allows easy access for people working downtown a great lunchtime (or pre/post work) paddle.  From almost anywhere in downtown Spokane you can be on the River in minutes!

2 Comments

Comment

How low can it go? A historic year on the Spokane River

This week Dan Partridge of the State Department of Ecology announced that the snowpack in Washington State is at zero percent of normal.  Snowpack feeds our surface waters, slowly melting and flowing into our rivers and reservoirs.  With no snow in the mountains, the flows in our rivers are severely reduced.  The Spokane River is no exception and as a result, flows are at record lows.  The graph below of flows of the Spokane River at Spokane shows past and current flow as a blue line and historical minimum flow as a blue triangle.  For example, on 6/17/15 the Spokane River flowed at just over 1,100 cubic feet per second (cfs).  The historical minimum for June 17th is just under 2,000 cfs.

In other words, we set a new minimum flow today, at almost half of our historical minimum.  spokane river flow and 10 day prediction 6-17-15

These historic lows are about 1/10 of average.  The historical mean on this day is just over 10,000 cfs.  Clearly the lack of snow in the mountains has a dramatic effect on our Spokane River flows.

Other factors influence the flow of the Spokane River other than snow.  The Spokane River flows from Lake Coeur d'Alene, through the Post Falls dam, and interchanges with the Spokane-Rathdrum Prairie Aquifer along the way.  Currently, Avista is releasing 619 cfs out of Lake Coeur d'Alene.  Their FERC (Federal Energy Regulatory Commission) to release 600 cfs from the Post Falls dam. At Spokane, the gauge reads 1120 today.  So the extra 501 cfs (1120-619), comes from our aquifer.

What does this mean for river users?  The whitewater rafting season was cut dramatically short.  Fisheries closures on the Spokane River are a possibility in the Upper River, due to the high temperatures created by the low flows.  Of course, on a positive note, low water levels reveal more garbage for our river litter clean up program to clean up!

Low flows revealed a bike under the Sandifur Bridge.

Comment

Comment

The Brown Waters of Hangman

The Spokane Riverkeeper received a flood of notifications last week recently regarding brown, dirty water in Hangman Creek.  Hangman Creek frequently contains turbid, sediment laden water during heavy rains or rain on snow events that cause the creek levels to rise astronomically (in some cases over 1000 cfs in 30 minutes).  What was unique about this pollution event was the lack of a dramatic rise in creek levels (see gage below).  Although the creek bumped up about 90 cfs, this is a tiny blip compared to the increases of 3,000 to 7,000 cfs Hangman frequently experiences.  So what explains the dirty water in the creek? A very muddy Hangman Creek on 5-20-15.

At the confluence of Hangman Creek and the Spokane River.  Hangman Creek is polluting the Spokane River.


hangman 5-17-15.gif

Poor farming practices, coupled with thunderstorms on 5/17/15, caused sediment laden dirt to flow from fallowed farmland directly into Hangman Creek and its tributaries.

A quick drive around the Hangman Creek watershed showed just how farming practices cause sediment to flow into our surface waters.  Clear signs of erosion on fallow farmland, such as erosional rills, deeply incised channels, and evidence of dirt on the road were abundant throughout the Mica Creek drainage (see photos below).  Fields farmed in this manner can lose up to 12-20 tons of soil an acre/year!  (To put that in perspective a large dumptruck load of soil weighs about 8 tons).  This erosion is preventable!  Planting a cover crop could reduce the massive amounts of erosion occurring in this area of the Palouse.  Erosion causes soil to be lost forever from this highly productive farmland while choking our surface waters.

The quick flow of surface water cause deeply incised channels.

Erosional rills carry tons of sediment to our creeks.

sediment from erosion on road

Streamside vegetation effectively filters sediment from polluted farmland runoff.  Unfortunately, riparian vegetation is sparse in the Hangman watershed, particularly on the intermittent streams that feed Hangman Creek.  Without riparian buffers along all “waters of the state”, our surface waters will continue to be polluted.

Of course it takes rainfall to cause runoff and locally heavy precipitation delivered ample rainfall to wash sediment into Hangman Creek.  Rain data from the Community Collaborative Rain, Hail, and Snow (CoCoRaHS) gages on 5/17/15 showed moderate rainfall accumulations of up to about 0.5” in Spokane and Whitman Counties.  That probably isn’t enough to explain the dirt in Hangman Creek, even accounting for the terrible farming practices in the watershed.  However, a comment from the CoCoRaHS station in Thornton, WA says:

“The big storm just skirted us last night. Unconfirmed reports of over 3.5" of rain east of Oakesdale, Wa, causing major damage”

If this storm hit unplanted fields that lack any riparian buffers, it would have caused the pollution we saw in Hangman Creek last week.

So what is the solution?  In Washington State it is illegal to pollute our surface waters.  If you see signs of erosion, such as erosional rills or sediment being carried to our surface waters, please report it to Ecology.  In Spokane call (509) 329-3400 to report a potential pollution violation.  Ecology is required to verify and act on these reports, so any reports you make go a long way to correcting pollution in Washington State.


Comment

Comment

Nitrates Here and There

Recently, I've heard a number of radio stories about nitrate levels in Iowa's Des Moines River.  I began to wonder how they might compare to nitrate levels in our watershed and I thought I would do some investigating. Back in Iowa, the city of Des Moines sued a number of counties upstream due to the high levels of fertilizer in the form of nitrate that is contaminating their drinking water supply and forcing costly removal.  My questions are just how high are nitrate levels in the Des Moines River, how do they compare with local levels of nitrate in Hangman Creek, and what are the possible implications for our watershed?

Nitrate is often applied to farmland as fertilizer.  It comes from other sources as well, such as septic systems and wastewater treatment plants, but most nitrate in surface waters comes from unfiltered runoff from fertilized fields.  In some cases, improper management of dairy manure can cause nitrate contamination in ground water.  Drinking water with high levels of nitrate can cause blue baby syndrome and impact human, particularly infant, health.

How high are the levels of nitrates in the Des Moines River?  They are certainly above the EPA drinking water limit of 10 mg/L.  In fact, they reach up to 16 mg/L, exceeding the safe drinking water limit for many months (see figure below).  It is clear that the Des Moines River is very contaminated with nitrates.

Des Moines River Nitrates

Recently I have been testing Hangman Creek water for nitrate.  The results of this testing reveal that Hangman Creek contains high levels of nitrates as well, at least relative to other Washington creeks and streams, but not as high as levels in the Des Moines River.  The graph below show nitrates in Hangman Creek compared to the Little Spokane River.  Hangman Creek contains 3-4 times more nitrates than the Little Spokane River and some of the highest in the state, according to Ecology data.

Nitrate levels in Hangman Creek are much higher than the Little Spokane River.

Looking at the Hangman watershed, this isn’t very surprising.  The watershed is roughly 50% agricultural and very little is being done to restrict the flow of surface waters and the associated nutrients to Hangman Creek.  In fact, surface waters are often intentionally channeled directly to Hangman Creek (see picture below)!  Sometimes this practice is technically legal, sometimes not, but it always comes at a high cost to water quality and fresh water ecosystems.  Although nitrogen isn’t usually the limiting nutrient in most freshwater ecosystems, it can affect sensitive freshwater ecosystems.

An excavated ditch flowing directly to Hangman Creek.

The Des Moines River, Iowa, contains very high and unhealthy levels of nitrate.  Hangman Creek does not reach these levels, but it does contain some of the highest nitrate levels in the state.  The intensive farming practices in the area, including ditching surface waters directly to the creek, allow nitrogenous fertilizers to runoff into our rivers and lakes.  This concerns us a great deal.

The Spokane Riverkeeper routinely monitors water quality, including nitrates, in Hangman Creek.  Our preliminary data agree with Ecology data and show that Hangman Creek contains high levels of nitrates as it exits the Palouse.  More on these data later...

Comment

Comment

Letter to the Governor: A Toxics Shell Game

We have been talking about this for months and can't stress it enough.  The Proposed Human Health Criteria Water Quality Standards fail to protect the health of consumers of locally caught fish and shellfish.  Washington proposed increasing the estimated amount of fish that we eat dramatically.  Raising that amount requires reducing the amount of toxins in those fish (and thereby the environment).  However, instead of proposing to reduce toxins, the Washington State Department of Ecology proposed increasing the acceptable cancer rate based on those toxins.  So in sum, no changes in water quality or fish toxicity would occur!  This shell game with toxins, fish consumption level, and cancer rate does nothing to protect fish consumers or our environment.  In a letter to Ecology, a number of local businesses and nonprofits, such as your Spokane Riverkeeper argue that the proposed criteria are inadequate.  Check it out here: 2015.3.23 NGO and Business Letter re WQS

Comment

Comment

In Support of Ecology...

Here at the Spokane Riverkeeper, we work to clean up and bring awareness to nonpoint source pollution.  Nonpoint source pollution, as its name implies, comes from many diffuse sources.  As rain or snowmelt runs over land it picks up pollutants and deposits them in our waters.  Our water quality monitoring program aims to bring attention to and measure theses pollutants in our streams.   On that note, check out how dirty Hangman Creek was this week (3/17/15)!  
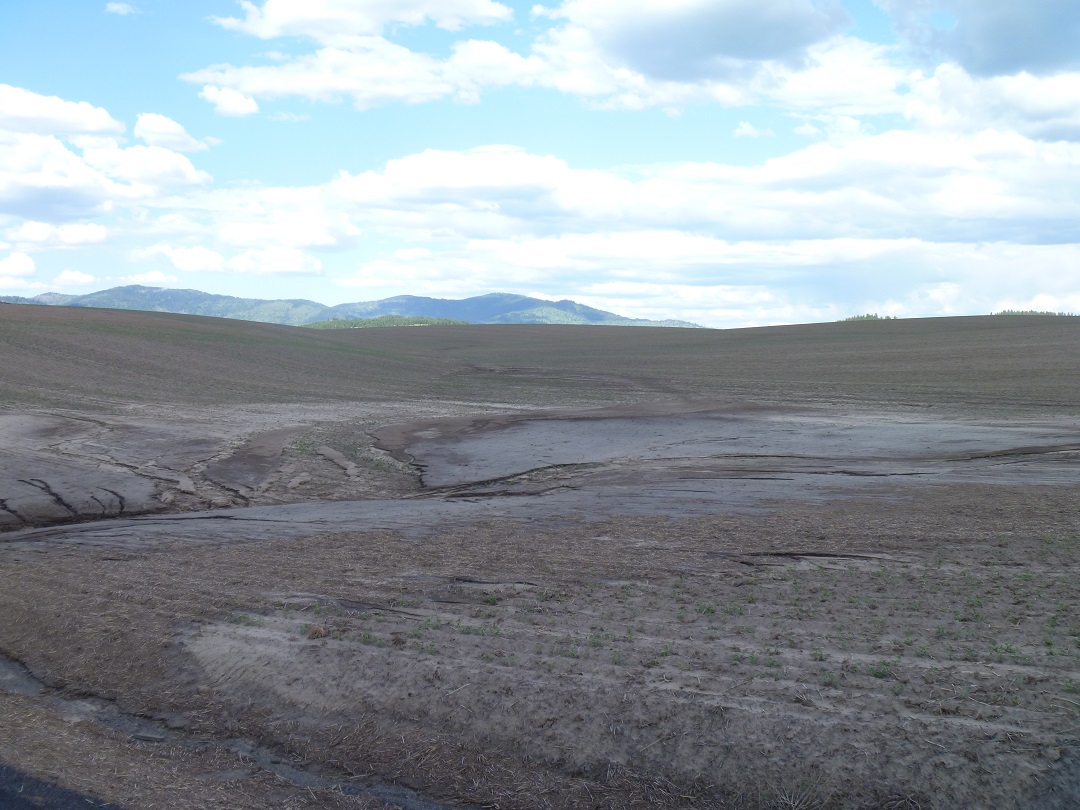
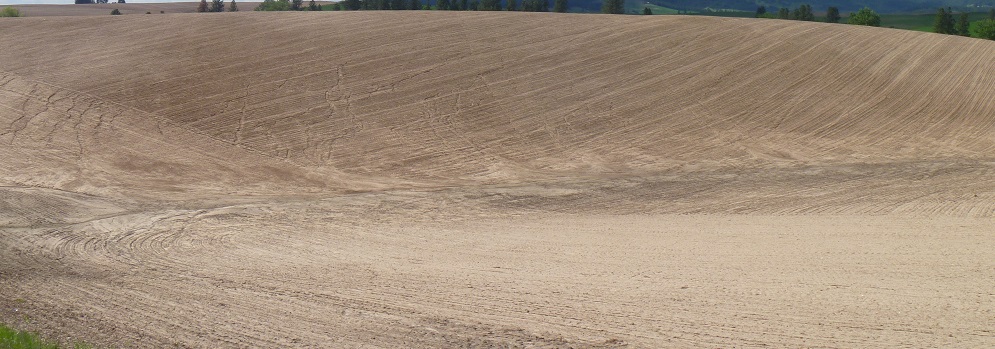
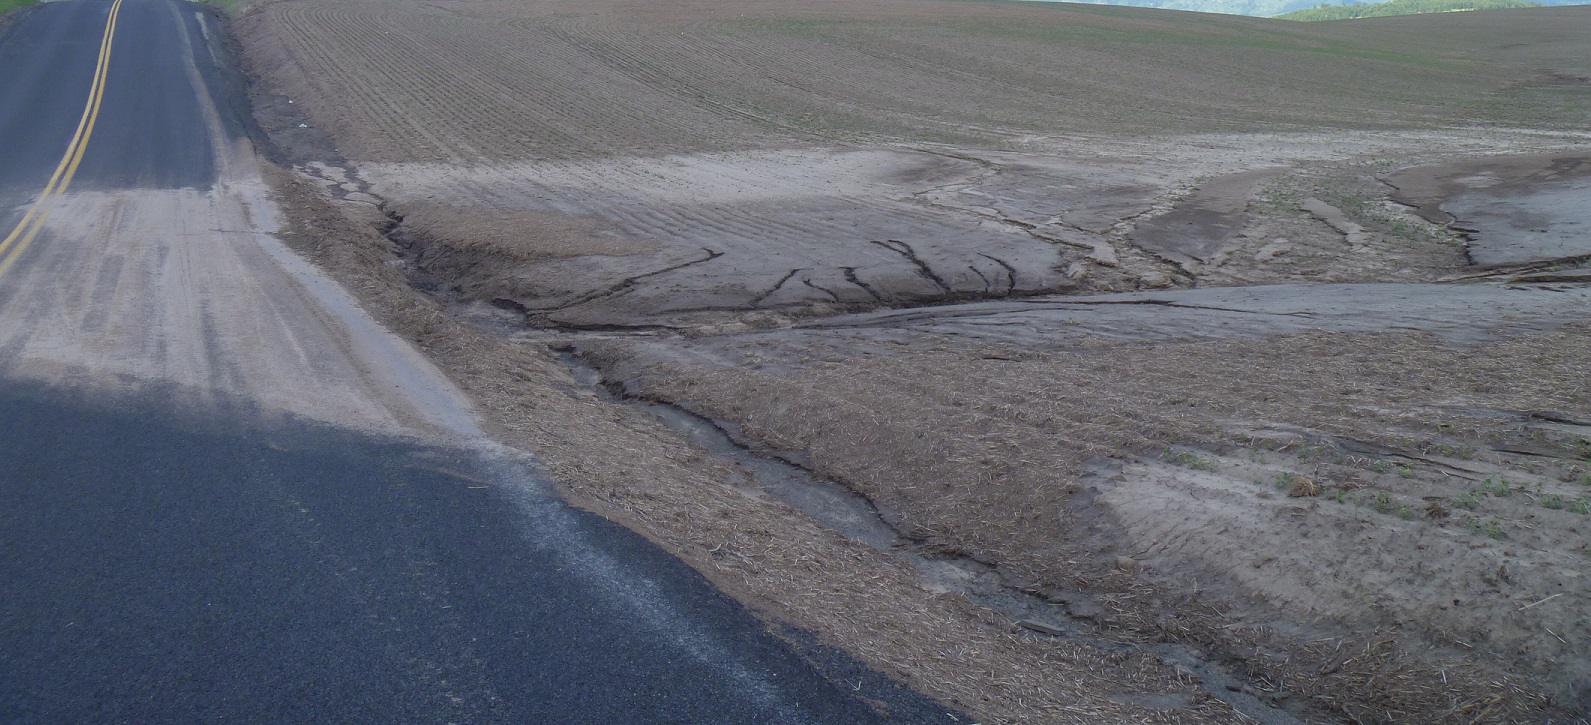
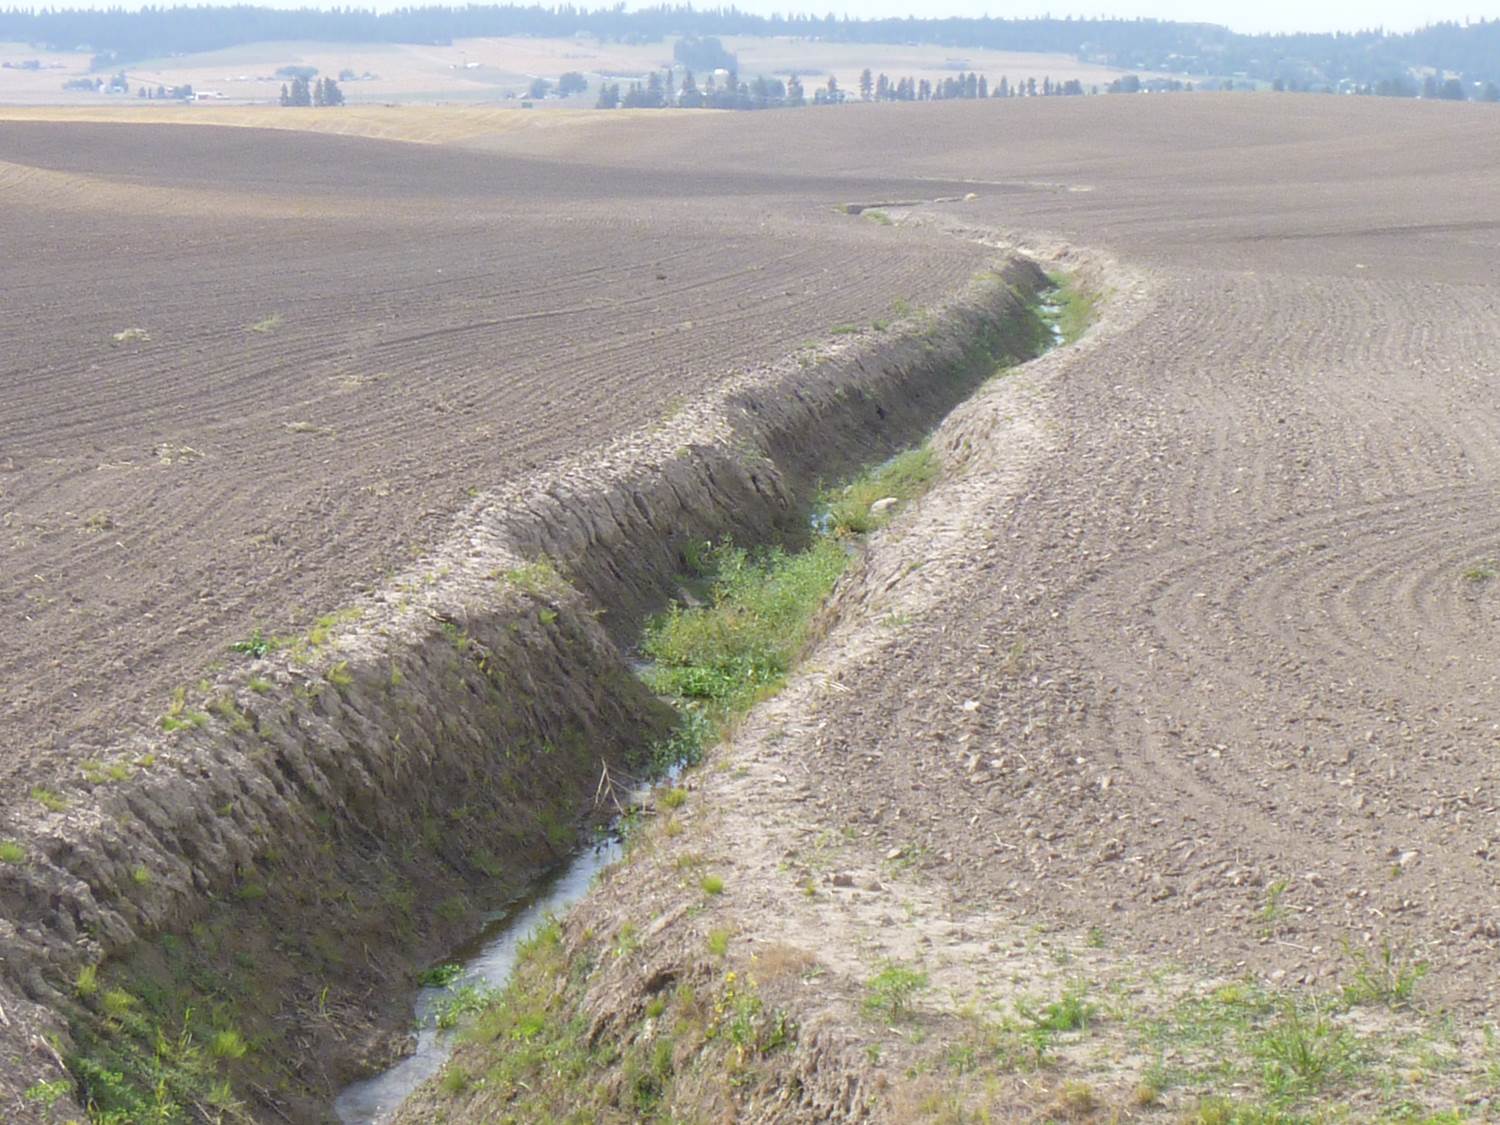
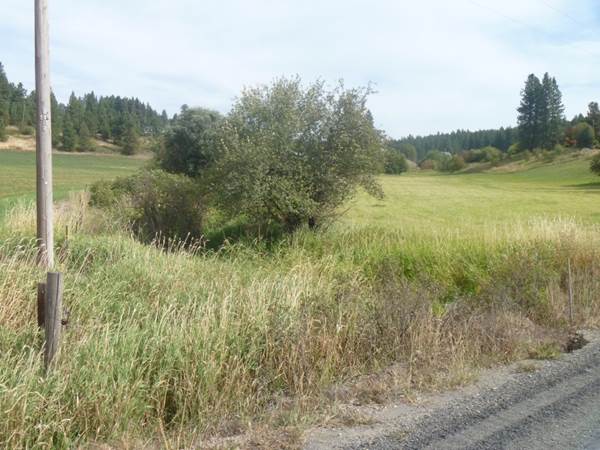
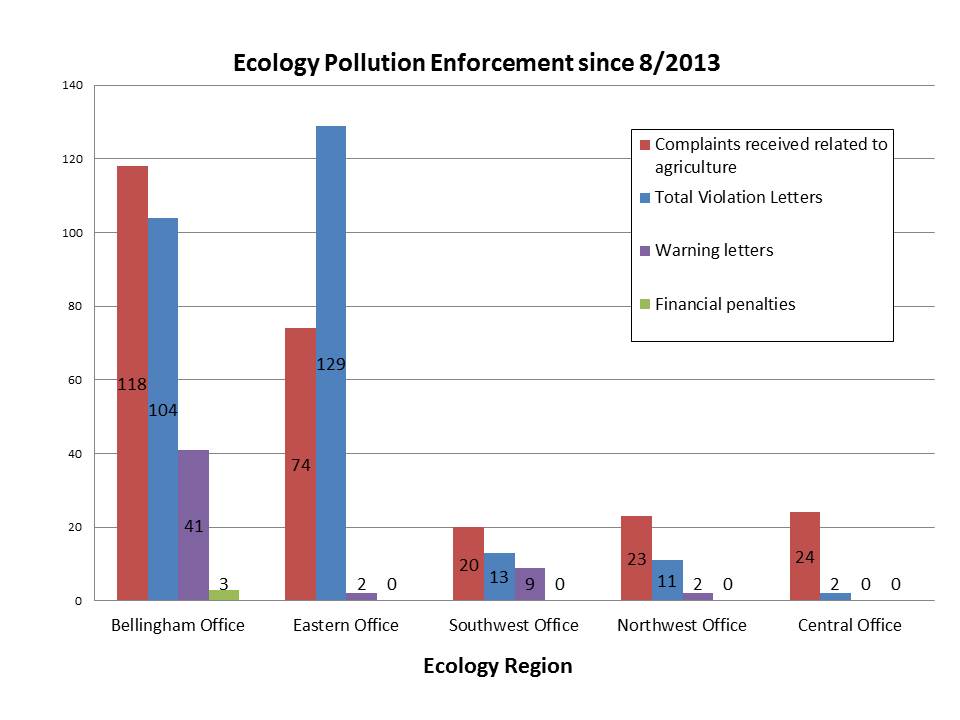
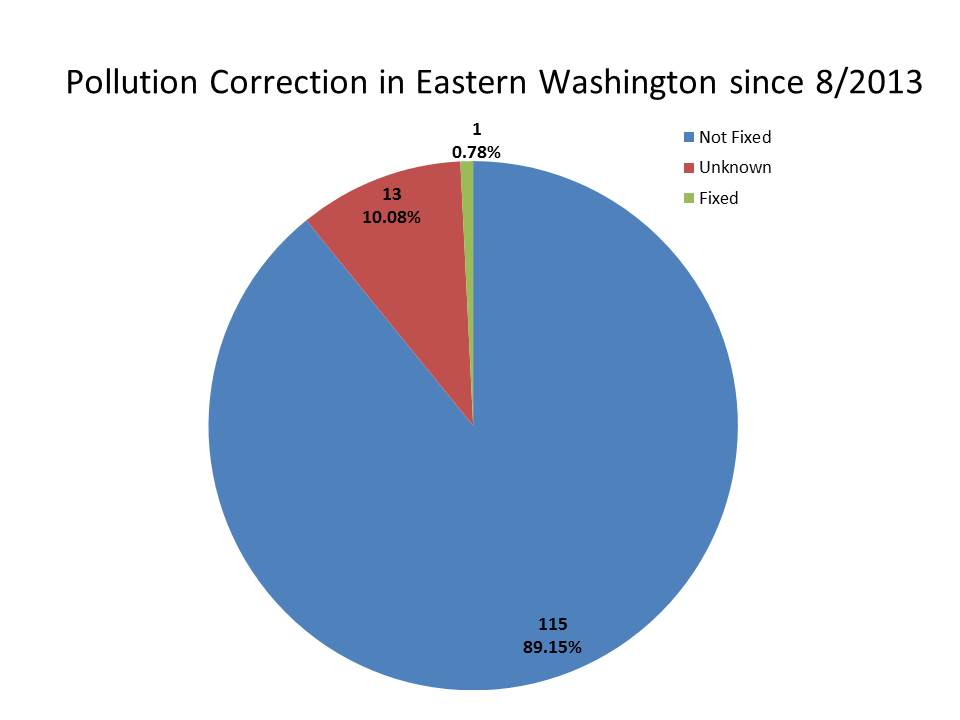
However, cleaning up nonpoint source pollution falls to a variety of organizations which employ a variety of methods.  The Washington State Department of Ecology (Ecology) is tasked with enforcing the environmental regulations in Washington State.  Recently, we wrote a letter to Ecology, supporting the work they do.  In short we said....

I want you to understand that much of the public that we represent stands with Ecology in their efforts to develop a non-point plan, establish the terms of compliance to this plan and we stand by the regulatory efforts of your ground teams to consistently hold parties accountable in protecting Washington’s public water resources.   

Check out the entire letter: Ecology letter 3-19-15.

Enforcing existing laws provides a strong regulatory backbone which will drive all other pollution control efforts.

Comment

Comment

Washington Deserves Clean Water and Clean Fish!

The Washington State Department of Ecology (Ecology) is proposing an increase the estimated amount of fish eaten per person per day to 175 grams.  That's good news!  Currently, Washington State woefully underestimates fish consumption at 6.5 grams of fish/per day.  fish3_1 Now the bad news.  Along with this rule comes a proposed tenfold increase in the acceptable rate for risk of cancer from one in one million to one in 100,000, as well as providing significantly more time for polluters to meet water quality standards.   This is in part because if you currently eat 175 grams of locally caught fish/day, you exceed greater cancer risk level of one in a million.

Instead of reducing the amount of toxins in our water and fish Ecology has proposed allowing for greater cancer risk. 

fish pipeHigh levels of toxins in fish disproportionally affect children, tribal communities, sport fishers and pregnant women.  These communities eat a higher ratio of local fish or are more vulnerable to risks of eating toxin laden fish.  So tell Ecology that we deserve clean water and clean fish!


Comment

Comment

Riparian Cover on the Little Spokane River

Streamside, or riparian, vegetation performs vital ecosystem functions for our waters.  To name a few, it keeps the water cool in the summer, filters pollutants, provides habitat, and contributes woody debris.   Portions of the Little Spokane River, like this one behind St. Georges School have great riparian habitat.  Healthy riparian habitat consists of a combination of tall mature trees, willows, and aquatic plants. Excellent riparian habitat along the Little Spokane River behind St. George's School.

However, portions of Deadman Creek, a tributary of the Little Spokane River shown below, need major improvements.

Riparian vegetation is absent along Deadman Creek.

A small riparian buffer, like the one shown below, filters out sediments, nutrients, toxins, and bacteria.

A portion of Deadman Creek with grassy riparian habitat.


Our native redband trout and other species that depend on our waters need intact riparian habitat.  For one, redband trout need cool waters of less than 20°C (68°F), which are kept cool from overhanging riparian trees and shrubs.

Comment